The global film industry is a $100 billion worth industry. There is a vast potential to earn money, and the producers are willing to sacrifice considerable costs to become a movie success. Pirates of the Caribbean: On Stranger Tides, the most expensive film, cost $379 million. With such an amount at your disposal, you may wonder how you should spend the money. Should you use them to get one of the biggest movie stars in your cast? For many, this may be tempting. One of the most famous actors, Tom Cruise, was rewarded $100,000,000 for his performance in Top Gun: Maverick. But was it worth it? Or could the money be better spent?
Introduction
Welcome to our interactive data story on the factors that influence box office success! We’ll be exploring a range of questions about what drives a movie’s financial performance. From analyzing the impact of release dates and the makeup of a film’s cast, to examining the role of plot themes and movie length, we’ll dive into the data to uncover the secrets of box office success.
So grab your popcorn and join us as we explore the data and see what insights we can uncover. And don’t forget to try out the interactive visualizations – you can play around with the data and see what factors have the biggest impact on a movie’s success. Let’s get started!
When to strike gold: the perfect release date for your movie
To begin with, we aim to investigate the influence of a movie’s release date on its box office revenue. Since our goal is to create a recipe for successfull movies in the future, we will focus on determining the best time of a year to release a movie by comparing the mean revenue of the different months. But with data spanning multiple decades, we knew we had to account for inflation to get an accurate picture. So let’s dive in and see what the data reveals about the perfect release date for a blockbuster movie.
Inflation-Adjusted Box Office Revenue: Can Older Movies Compete?
Our analysis shows that there is a clear need to adjust for inflation when looking at the correlation between release year and revenue. In fact, the Spearman Correlation Coefficient of 0.01 and p-value of 0.4 reveal that there is little to no correlation between the two variables after correcting for inflation. But don’t worry, we’re not done yet! Next, we’ll delve into the specific months of the year and see if there are any standout performers in terms of revenue. Stay tuned!
What’s the Best Month to Release a Movie?
We dive into the data to discover if certain months are more likely to lead to blockbuster hits. By analyzing the correlation between the month of release and revenue, we find that most months have statistically significant differences in mean revenue. In particular, June emerges as the clear winner with the highest mean and lowest p-value when performing a One-way ANOVA test. But is June the best month for all genres? We take a closer look at the top ten most common genres and find that the most promising month varies for each. Get ready to mark your calendars and plan for box office success!
Now let’s delve into the specific release months that tend to bring in the most revenue for each genre. Adventure and action movies tend to perform best in May, while crime fiction, comedy, drama, romantic comedy, and thriller films see their highest mean revenues in June. On the other hand, romance films tend to perform best in November, and indie films see their highest mean revenues in December. It’s clear that the best month for a movie’s release depends on its genre, so it’s crucial to consider this factor when deciding on a release date.
Spice Up Your Movie Recipe: The Importance of Diversity
To analyze the effect diversity has on movie box office revenue, we first had to estimate the diversity of each movie. There are several ways to assess the diversity in a film which may lead to different results than we will present. The first thing we had to do was to figure out a way to estimate diversity based on our data. We decided to use ethnicity and gender as the estimates for the diversity of each movie. These two aspects will give a partial picture of diversity’s effect on a movie’s success. The next step was to give each film a “score of ethnicity” and a “score of gender.” We observed a high correlation between the number of actors in a film and the movie’s box office revenue. It was, therefore, essential to find a score that considered the number of actors. To estimate ethnicity, we introduced the “ethnicity score,” which counts the number of ethnicities present in a movie and divides it by the total number of actors. We also considered different approaches, such as giving higher weight to rare ethnicities, but concluded that our approach would suffice for our analysis, which is to look at the effect of diversity on revenue and not to get a complete insight into the diversity in each movie. To estimate gender, we introduced the “fraction of females,” computed by counting the number of female actors and dividing it by the total number of actors in that film.
Ethnicity
The Evolution of Ethnicity
The ethnicity score in movies has increased in recent years, but less than ten movies are released yearly with an ethnicity score above 0.5 (after 1986). When we adjust the threshold for the ethnicity score, we observe a clear increasing trend from zero to the point of 0.7. Increasing the threshold above 0.5 gives a more unreliable result, as the more significant 95% CI indicates. The reason is likely because of the low number of movies, which provides each film with a more substantial impact on the mean revenue. Another possible explanation is that these movies first occur in recent years, and the audience has yet to decide whether this ethnicity score increases their movie experience.
The Sweet Spot
We grouped our data into five based on their ethnicity score to find the best ethnicity score interval, or as we like to call it, The Sweet Spot. In the search for the best interval, we found an ethnicity score between (0.6 – 0.8] to be the most lucrative considering revenue maximization when we look at the mean revenue in our data set. However, overlapping 95% CI between (0.2 – 0.8] prevents us from concluding which interval is the best. On the other side, we observe that the extreme cases of ethnicity score between (0 – 0.2] and (0.8 – 1] perform poorly, telling us that ethnicity score is something you should consider planning your next movie. You better stay between (0.2 – 0.8) if you aim to become rich $ Further, the uncertainty associated with the revenue estimate for the interval (0.6 – 0.8] is worth noticing. Even though this interval resulted in the highest revenue in our data set, there is no guarantee that this will apply in general. This interval is for the gambler; if you do not have the guts to take a loss, you better stay in (0.4 – 0.6]!
Time to Enter the Movie Market?
A good investor never solely depends on historical data; they try to predict the future! We looked at how the ethnicity score market has changed in recent years, using this to predict the future journey. Since the primary goal of this analysis is to make a recipe for a movie´s success, we looked at recent movies, starting with films after the year 2000. We observed that the treated group (the group with an ethnicity score above the given threshold) tends to lie above the control group (the group with an ethnicity score below or equal to the given threshold). Still, we cannot find a statistically significant difference between the two groups. Maybe it is best to wait for this one out. However, the time in the market beats the timing, so if you love movies as much as we do, you should not take this as a discouragement to invest.
Paired Matching – The Classic
Our analysis so far has been naïve, not considering that many confounders may affect the revenue. To try to isolate ethnicity’s effect on revenue, we have performed a paired matching. By completing the paired matching, we try to compare movies with similar probability of receiving the treatment, which in our case is an ethnicity score above 0.5. We used logistic regression to compute the propensity score based on the movie runtime, the year the movie was released, the number of languages present, and the number of countries the film was shown. With a threshold of 0.5 on the ethnicity score, we did not find any statistically significant difference between the two groups. Was all this reading just a waste of time? Not so fast!
Paired Matching – The Experienced
If it were as easy as just using paired matching with a threshold of 0.5, everyone would have been movie millionaires. To further analyze the results, we adjusted the threshold from 0.5 to 0.33. This adjustment discovered that movies with ethnicity scores above 0.33 achieve significantly better revenue than movies with ethnicity scores below or equal to 0.33.
Gender
The Evolution of Gender
We observed an increase in the fraction of females over time. However, a high fraction of females tends to generate lower revenue, except for a peak in revenue at 0.7. It is also essential to notice the uncertainty associated with the mean estimate. The uncertainty is high in the interval between 0.5 – 0.7, which indicates that more data may be needed to conclude. Movies with a threshold above 0.5 did not have above ten releases until 1990, and the poor revenue might be caused because it takes time for the audience to digest this change.
What is the Best Fraction of Females?
To obtain better insight into a movie’s best fraction of females, we divided the film into five groups based on their female fractions. We observe that the worst performing interval is the fraction of females between (0.8 – 1]. In comparison, the movies with a fraction of males between (0.8 – 1] perform well and have the highest mean in our data set. There may be several reasons for this, for example, that the most attractive genre may be better suited for male actors. We will try to isolate the effect of fractions of females in the paired matching later in this analysis, but for now, we will stick to our naïve approach. The most crucial intel for now is to avoid a fraction of females between (0.8 – 1] in your movie. It is more challenging to select the best interval, as the groups (0 – 0.2] and (0.2 – 0.4] have 95% CI that overlaps.
Buy the Dip?
Our result has shown that movies with a high fraction of females perform poorly, but is this about to change? This analysis aims to find the best fraction of females if you were supposed to release a movie today. To do so, we will investigate the effect over time and look at the trend after 2000. We find that the control group’s mean revenue lies above the treated group’s for all the considered thresholds. But much overlap between the 95 % CI prevents us from concluding. We do not find any signals in the market indicating that movies with a high fraction of females will start to perform better. But the difference is insignificant, so minor changes may give better results.
Paired Matching – The Classic
As mentioned earlier, several factors may affect the movie revenue, and there is no guarantee that our findings are genuinely caused by the fraction of females in the movie. To try to isolate gender’s effect on revenue, we have performed a paired matching to compare movies with similar probability of receiving the treatment, which is a fraction of females above 0.5. We used logistic regression to compute the propensity score based on the movie runtime, the year the movie was released, the number of languages present, and the number of countries the film was shown. Using the threshold of 0.5 on the fraction of females, we discovered that movies with a fraction of females below 0.5 achieve statistically significantly better revenue.
Paired Matching – The Experienced
To further analyze the results, we adjusted the threshold from 0.5 to 0.33. This adjustment increased the mean difference between the treated and control group even further.
Star Power: The Influence of Cast on Movie Revenue
Ever wonder how much of a role the cast of a movie plays in its financial success? In this section, we’ll delve into the relationship between a movie’s cast and its box office revenue. We’ll analyze the impact of individual actors on a film’s financial performance. We’ll also conduct network analysis to evaluate the roles of actor combinations in generating revenue. Whether you’re a fan of A-list celebrities or indie darlings, let’s find out if the cast really does make a difference in box office success.
Who’s the Biggest Box Office Draw? Analyzing the Impact of Actors on Revenue
We want to understand how much the people in a movie contribute to its financial success. To do this, we’re using linear regression. It helps us see how strong the relationship is between a movie’s cast and its box office revenue, and if anything else could be affecting this relationship. By fitting a line to the data, we can see how much each actor matters for a movie’s financial performance.
We’re only looking at actors who have been in more than 10 movies. This helps us exclude one-time wonders and makes sure our findings are more typical of the movie industry. It’s possible that actors with fewer movies can affect a movie’s financial success, but these cases might not be as accurate or typical. By sticking to actors who have more experience, we can feel more confident about the conclusions we draw about what leads to financial success in the movie industry.
| Actor | coefficient (in million $) | p-value |
|---|---|---|
| Cate Blanchett | 107.8 | 0.000 |
| Seann William Scott | 83.2 | 0.000 |
| James Franco | 74.5 | 0.003 |
| Johnny Depp | 60.7 | 0.004 |
| Anna Faris | 58.5 | 0.010 |
One interesting thing we found is that, out of the top 10 factors that seem to matter most for movie revenue (based on how strong their relationship is and how likely it is that this relationship isn’t just a coincidence), the only ones besides budget are the actors. This suggests that these actors make a big impact on how much money a movie makes. But it’s important to remember that an actor’s impact on revenue might not just depend on their own performance. It could also depend on who they’re acting with in the movie. For example, an actor might do better at the box office when they’re in a movie with certain co-stars, but not as well with others. This is why we used network analysis to look at how actors work together and see if that affects revenue. For example, will Cate Blanchett rank as one of the top revenue-generating actors when we consider actor communities?
It’s also worth mentioning that budget is a big factor in how much money a movie makes, but it’s closely related to the revenue itself. This means it might not be as useful for understanding the impact of individual actors. We’ll come back to budget later in our analysis.
The Movie Cast Factor: How Actor combinations affect financial success
Have you ever noticed that some actors seem to be in a ton of movies together? Network analysis can help us see these connections between actors and how they might affect each other’s impact on a movie’s revenue. By turning the relationships between actors into a visual network, we can find patterns and communities in the movie industry and get a deeper understanding of how actors contribute to revenue. Network analysis can give us some really interesting insights and help us make sense of all the complex data we have about actors and revenue. Overall, adding this technique to our analysis of actor contributions can help us understand things in a new way.

We made a graph that shows how actors are connected through the movies they’ve been in together. The size of the nodes shows how much the movies that actor was in made on average, and the thickness of the lines shows how many movies the actors were in together.
Our graph has 61 actors and 256 connections. In the next section, we’ll take a closer look at it and use network analysis techniques to see what we can learn. We’ll use these techniques to find groups of actors who often work together and see how important each actor is in the network. By looking at these actor communities, we can get a more detailed picture of how actors collaborate and how different combinations of actors affect movie revenue.
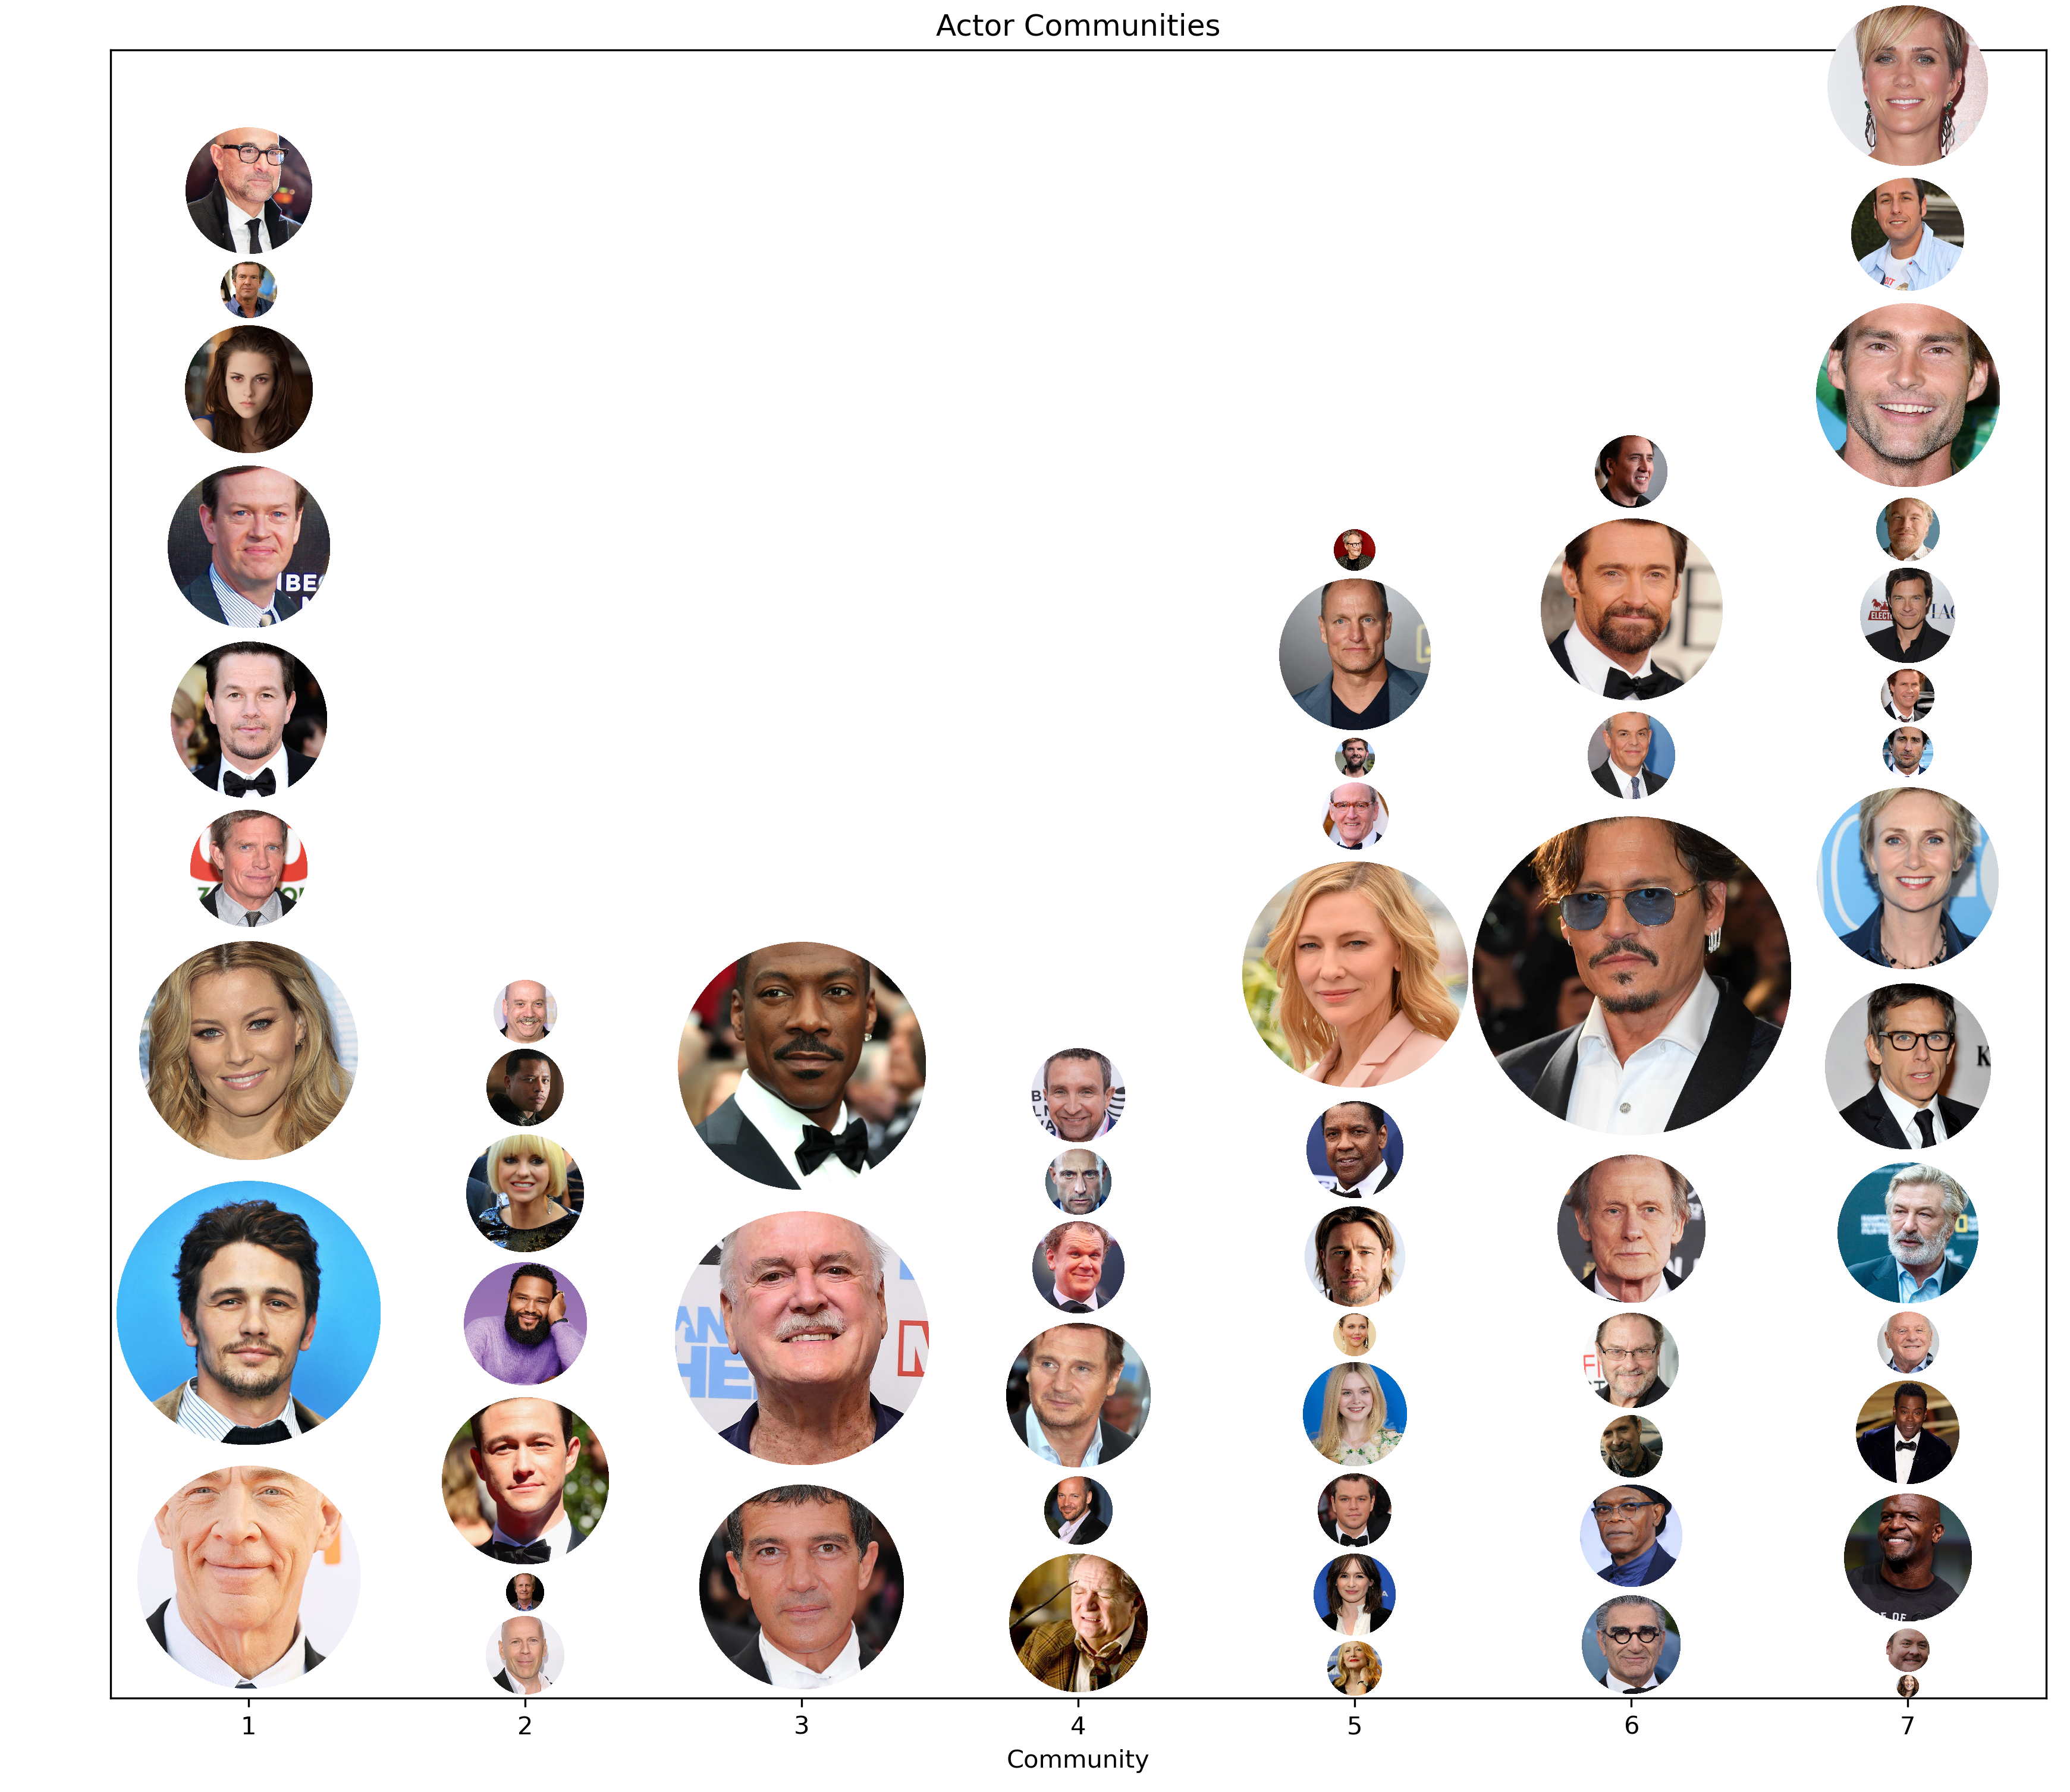
We used the Louvain method to split the network of actors into six different communities based on how they’re connected through movies. This shows us that there are some actors who tend to work together more often. When we looked closer, we saw that the average revenue for actors in each community varies. Some actors seem to do especially well at the box office. However, we also saw that there was no significant difference in average revenue between the communities, with one exception. This could mean that the community an actor belongs to doesn’t necessarily have a big impact on how much money their movies make.
Regardless, it’s still interesting to see how actors are connected and how they collaborate. By looking at these patterns and communities, we can get a better understanding of the movie industry and how different combinations of actors might affect revenue. We’ll plot the initial graph again, but this time we’ll highlight the connections within each community and the connections between communities. This will help us see the patterns of collaboration and how they relate to movie revenue.

We want to know if there’s a difference in revenue when a movie’s cast is mostly made up of actors from one community versus actors from a bunch of different communities. To do this, we’ll look at the patterns of collaboration within and between communities and see how they affect revenue.
To understand the relationships between actors and their impact on revenue better, we’re going to split the movies into two groups: those with a cast that’s mostly made up of actors from one community, and those with a cast that’s more evenly spread out among different communities. This will let us compare movies with more similar casts to movies with more diverse casts, and see if there’s a relationship between cast composition and revenue. By looking at these two groups of movies, we can get an idea of the pros and cons of casting actors from one community versus a mix of communities, and how it might affect a movie’s success.
We noticed that there’s a big difference in average revenue between movies with a cast that’s mostly from one community and movies with a more evenly distributed cast. To make sure this difference isn’t just because of other factors, we’re using matching to compare movies with similar characteristics. By controlling for these other factors, we can be more certain that any differences in revenue we see are because of the cast composition. This will help us understand the relationship between cast composition and movie revenue better. The next plot compares movies with a cast that is largely concentrated within a single community to those with a more evenly distributed cast. We’ve matched these movies so that other factors that could affect revenue are controlled for.
Our analysis shows that movies with a majority of actors from a specific community have a big impact on box office revenue. In both estimates, with and without matching, the treatment effect was huge - around $51620924.7 and $39424016.7, respectively. The difference between these two estimates was around -23.63%, and both estimates were statistically significant with a p-value of 0.0.
We didn’t use budget as a matching variable in this analysis because it’s probably closely related to the cast. If we used budget as a matching variable, it might be hard to see the independent effect of the cast on revenue. That being said, budget is still an important factor that can affect a movie’s production value and overall appeal to audiences. For example, a movie with a high budget might make more money because it has more money for marketing and a wider distribution.
Runtime: The Sweet Spot
Are you ready to find out if a movie’s runtime can make or break its box office success? From epics to quick hits, we’ll delve into the data to discover whether longer or shorter films come out on top. But before we get started, let’s take a quick look at the distribution of runtime across all movies and see which range is most common.
It looks like most movies fall within the 80-120 minute range, with a slight skew towards the longer end of the spectrum.
Now that we’ve looked at the distribution of runtime across all movies, let’s see if longer or shorter movies come out on top in terms of box office success. At first glance, it looks like there might be a slight positive relationship between the two. But when we dig a little deeper using linear regression, we see that this relationship isn’t strong enough to draw any solid conclusions. In fact, the R-squared value is pretty low, meaning that runtime isn’t a strong predictor of box office success.
However, when we break things down by runtime intervals, we see that movies with runtimes between 80-120 minutes seem to generate larger revenue compared to the movies with runtime less than 80 minutes. This raises the question: is 80 minutes some kind of threshold for box office performance? We’ll explore this further in the next section.
Does it hurt if runtime is too short?
It seems that shorter movies may have a harder time raking in the big bucks. In fact, our analysis shows that movies with a runtime under 80 minutes tend to generate significantly less revenue than their longer counterparts. But don’t worry, it’s not all bad news for short films. While it may be tougher for them to reach blockbuster status, there are still shorter movies that manage to perform well at the box office. So, the takeaway here is that while runtime alone may not be a make-or-break factor for a movie’s success, it’s definitely something to consider when trying to craft a recipe for box office gold.
It’s clear from our analysis that shorter movies tend to struggle at the box office compared to their longer counterparts. In fact, our independent t-test showed a statistically significant difference in revenue between short and non-short movies, with short movies earning an average of 53.9% less. So, if you’re thinking about making a movie, it might be best to aim for a runtime of at least 80 minutes to give your film the best chance at box office success.
Are blockbuster movies generally longer in runtime?
Are longer movies really the key to box office success? Let’s take a closer look at the data to find out. We found that when comparing short movies to non-short movies, the latter tends to generate significantly more revenue. In fact, short movies make on average 53.9% less revenue than non-short movies. But wait, there’s more! When we compared the runtime of blockbuster movies (those with a revenue of $400 million or more) to non-blockbusters, we found that blockbusters tend to have longer runtimes on average. In fact, blockbusters have a runtime that is 10.05% longer than non-blockbusters. It seems that there may be some truth to the idea that longer movies have an advantage at the box office. However, it’s important to keep in mind that this is just a tiny piece of the puzzle. There are many other factors that can impact a movie’s success, and it’s likely that the relationship between runtime and revenue is not a simple one.
The Power of Words: How Movie Plot Sentiment Affects Box Office Success
In this section, we delve into the power of words in movie plot summaries and how they can impact a film’s box office success. By analyzing the proportion of positive, negative, and violent words in plot summaries, we can gain insights into how movie studios can craft engaging and successful storylines. Join us as we explore the relationship between sentiment analysis and revenue!
From our bar plots, it appears that movies with a higher proportion of negative words in their plot summary tend to have higher revenues compared to movies with a higher proportion of positive words. One potential reason for this could be that negative themes and storylines often generate more interest and tension, which can draw in larger audiences. Similarly, movies with a higher proportion of violent words also tend to have higher revenues, possibly because violent content can also be seen as more exciting and engaging. It’s important to note that while there is a correlation between these plot characteristics and box office success, this does not necessarily mean that including more negative or violent elements in a movie’s plot will guarantee higher revenues. Other factors, such as the quality of the movie, the acting, and the overall production value, also play a significant role in a movie’s success.
In conclusion, our analysis of plot summaries has shown that movies with more negative plot are more successful, with a 45.3% increase in revenue compared to movies with more positive plot. This finding highlights the importance of considering the sentiment of a movie’s plot when striving for box office success. So next time you’re planning a blockbuster hit, don’t be afraid to inject a little bit of negativity into your story.
Sentiment Showdown: Comparing the Plot Summaries of Blockbusters and Non-Blockbusters
Blockbuster movies appear to have a preference for negative and violent plot elements, as indicated by the higher proportion of negative and violent words in their summaries. This is supported by the small p-values and the significant mean differences found in our independent t-tests. In comparison, blockbusters tend to have a lower proportion of positive words in their summaries compared to non-blockbusters. These findings suggest that incorporating more negative and violent elements into a movie’s plot may increase its chances of becoming a blockbuster, while a more positive plot may hinder its box office success. However, it’s important to note that these results should be interpreted with caution, as other factors may contribute to a movie’s box office success.
The secret recipe for box office success: A data-driven guide
Congratulations, you’ve reached the end of our data-driven guide to creating the ultimate box office hit! Now it’s time to put our findings into action and cook up a recipe for success.
But before you start gathering your ingredients, it’s important to remember that just like in cooking, the success of your movie will depend not only on the individual ingredients, but also on how they all work together. Adding a superstar actor like Johnny Depp to your cast might sound like a no-brainer, but it’s also important to consider how that will affect the rest of the cast and the overall direction of the film. Similarly, changing the genre of your movie might mean that you need to reevaluate the best release date to maximize your revenue.
So, without further ado, here’s our recipe for the ultimate box office hit:
- Aim for an ethnicity score above 0.33 to attract a diverse audience
- Keep the fraction of females in your cast below 0.33 to appeal to a wider audience
- Consider the genre of your movie when choosing the best release month. Action, action/adventure, and adventure movies may do best in May, while crime fiction, comedy, drama, romantic comedy, and thrillers may perform best in June. Romance films may fare well in November and indie films may do well in December.
- The right combination of actors in your movie cast can make a big impact on its box office success. Keep in mind that having a majority of actors from a specific community can significantly affect your revenue.
- Don’t be afraid to add a dash of negativity to your plot - it might just be the secret ingredient that sets your movie apart. And last but not least, don’t forget to season your recipe with a generous helping of violence - it could give your movie the edge it needs to be a blockbuster.
With these ingredients in hand, you’re well on your way to creating a box office hit that will have audiences coming back for seconds. Happy cooking!